Seqanswers Leaderboard Ad

Collapse

Announcement

Collapse
No announcement yet.
X
 
  • Filter
  • Time
  • Show
Clear All
new posts

  • pmiguel
    replied
    Originally posted by AmitChaurasia View Post
    This is truly helpful to solve my long pending case with the customer...

    Kindest Regard's
    Amit
    Glad to help...
    --
    Phillip

    Leave a comment:


  • AmitChaurasia
    replied
    Originally posted by pmiguel View Post
    I don't think there is much chance that "AndyG" is still monitoring this thread, but just in case anyone reading this now would be helped:

    Those double peaks are almost certainly a main peak and a "bubble product" peak. AndyG's protestations to the contrary suggest he doesn't get the concept.

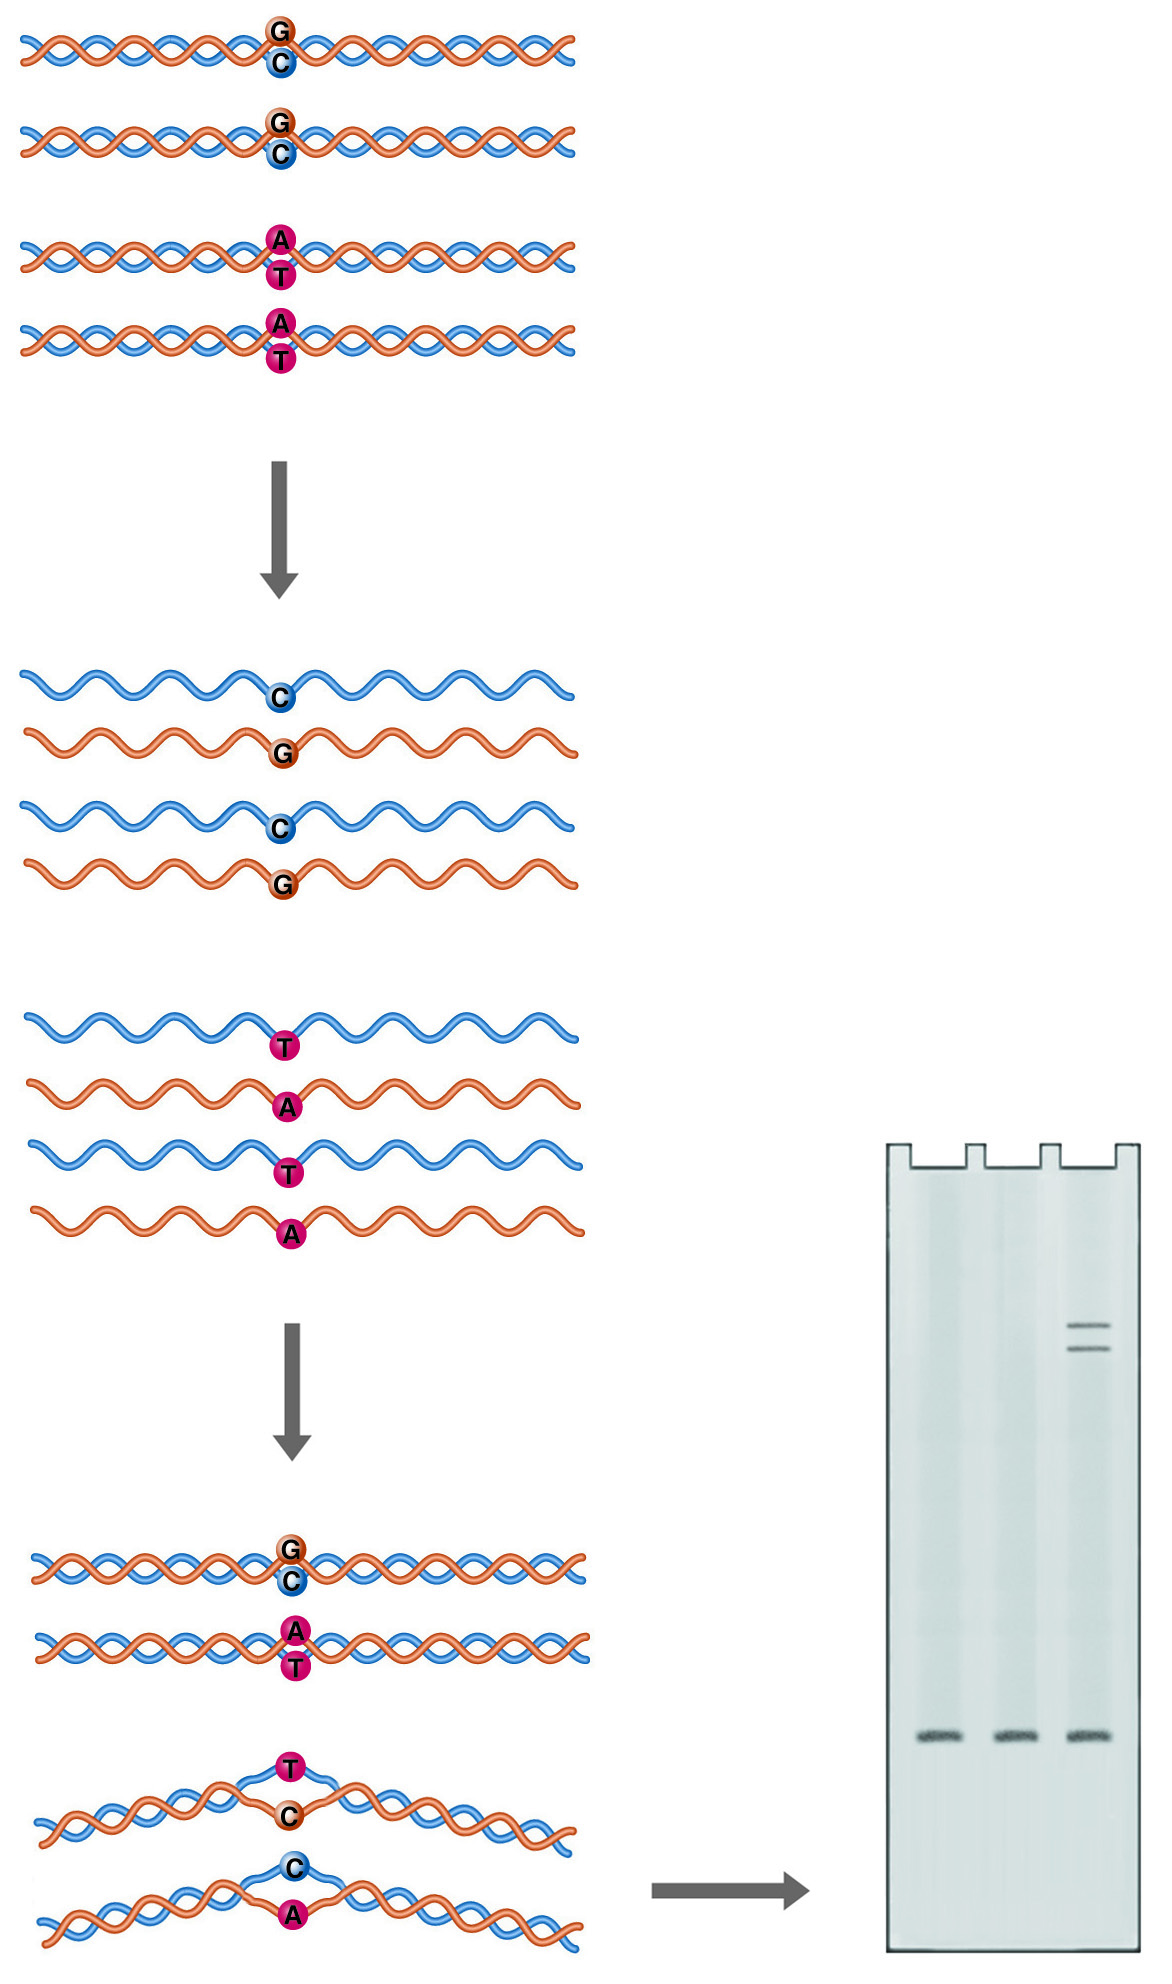
    Bubble products are said to form when adapters from 2 product strands anneal to each other. Because a great number of different inserts will comprise a library, it is unlikely that any 2 product strands will be complementary in the middle. So you end up with the "bubble product", a molecule annealed and double stranded at either end but the non-complementary middle section remains as a double single-strand "bubble" domain.

    As you might imagine, this floppy thing migrates more slowly than its more compact fully double-stranded brethren. An Agilent chip will not correctly estimate its molecular weight by a variable amount. The fact that the two peaks overlap one another is not a sign that one is not a bubble peak.

    Normally bubble peaks cause no issues for sequencing as long as you use qPCR to estimate the concentration of your libraries.

    But, if you see bubble peaks, it is an indication that your PCR primer concentration has become limiting in the PCR reaction. At high primer concentrations, the primer annealing to a product strand will be kinetically favored over two product strands annealing.

    Strand melting your library and allowing the strands to find their correct complements is a waste of time. Don't do that.

    If you can't stand the idea of bubble products in you sample, you could probable get rid of most of them by adding your library to a fresh PCR reaction, with lots of primer and then doing a single cycle -- starting with a denaturation. This would allow the high amounts of primers to anneal and be extended into a double-stranded product.

    But this is also a waste of time. Again, the bubble products don't actually cause problems.

    They are an indication that you used more PCR cycles than were necessary. So you could cut back the number of cycles next time you made libraries.

    --
    Phillip
    This is truly helpful to solve my long pending case with the customer...

    Kindest Regard's
    Amit

    Leave a comment:


  • aelhage
    replied
    Dear all
    I do have double peaks in my dsDNA HIGH SENSITIVITY bioanalyser traces of rna-seq libraries (prepared using NEBNext ultradirectional RNA library prep for illumina cat. no. E7420). The smallest peak around 250-300bp and the largest one around 1500bp.
    I can understand from your very interesting posts that I should send these libraries for illumina sequencing providing accurate measurements of DNA concentrations would be performed by KAPA q-PCR kits? I hope I did get this right?
    Alternatively, I could add extra primers and perform a second standard PCR on my library with only 1 cycle with a 2 min denaturation step, hoping that the extra peak would disappear!?
    Thanking you very much for the great advice you are providing!
    Best wishes
    AEH
    Last edited by aelhage; 10-26-2015, 12:44 AM.

    Leave a comment:


  • pmiguel
    replied
    By the way, don't trust the concentration of Illumina phiX, it is always much below the 10nM it is supposed to be. The KAPA standards work fine.

    --
    Phillip

    Leave a comment:


  • pmiguel
    replied
    Hi Emilia,
    With the additional information you provide I'm 90% certain that your samples were overclustered. My advice is to trust the KAPA results an size adjust based on the size of the shorter-length peak.
    If you want to know whether high bias is an issue, then set your SAV "data by cycle" pane to "% base" and it will be immediately apparent.

    --
    Phillip

    Leave a comment:


  • EmiVig
    replied
    Hi pmiguel,

    thank you very much for your hilightening reply and here I am for an updating!
    As suggested, I measured my histone ChIP-seq libraries using the KAPA kit (I used the DNA standards provided by the kit and I followed the instructions for size-adjustement) and I ended up with almost double the concentrations than the Qubit, therefore this would sustain the hypothesis of flowcells overloading. Without size-adjustment instead, the concentration resulted instead lower. So my first question is: is it right to perform a size adjustment? I would do it, since indeed my libraries have a different average size then the DNA standards.
    At the same time, I've generated a standard curve using PhiX, as suggested by Illumina, because our sequencing facility tested the cluster generation using PhiX. I obtained a lower concentration (without size-adjustment even lower...) than what I obtained initially with the Qubit!!
    At the end, I got back two opposite results ...I'm a bit stuck now...I would be more prone to believe to the high concentrations measured by KAPA qPCR (using KAPA DNA standards and size-adjustemnt), since I might have a good portion of "ssDNA bubble product" which the Qubit is not able to detect ...but how could I be sure of that? I'm thinking of sequencing in parallel the samples taking in consideration one or the other concentrations...but it would be a waste of material/time/money..
    Moreover, last time I multiplexed 3 samples per lane...might also the low-complexity being an issue? I would like to barcode 6 samples per lane this time.
    Please, find attached a summary of the concentration values obtained with the different methods + I also attached the Sequenicng Analyzer Viewer of my failed sequencing (lane 7 and 8). I'll attached as soon as possible the Bioanalyzer traces of the libraries.
    I hope I'm not bothering too much, but I think this might also be helpful to somebody else encountering similar problems...
    I would really appreciate any help! Thank you so much in advance!

    Emilia
    Attached Files

    Leave a comment:


  • pmiguel
    replied
    Hi Emilia,
    It is strange that your cluster density is too low. Are you sure that it is really too low? When you really overload a lane the cluster-calling software is overwhelmed and can report a low density.

    How to tell the difference between a truly low cluster density and an a badly overclustered lane? If it is truly low cluster density, usually your pass-filter% and overall quality values will be very high. If your lane was massively over-clustered then the pass-filter % and quality values will be low.

    Here is why I think you may have over-clustered. If you take a library with a large component of "bubble-products" and check its concentration with a fluorimeter using a double-strand-specific dye, then the bubble products will be under-reported, right? The central portion of each bubble product amplicon will have completely un-annealed central portions and thus be effectively single-stranded. However these bubble products each contain 2 amplicons, each capable of clustering. This should cause you to underestimate the true concentration of your library using a Qubit if a large amount of your library is bubble products.

    Of course this is all wanton speculation on my part. There are a dozen other factors I don't know about that could be causing your issue.

    --
    Phillip

    Leave a comment:


  • EmiVig
    replied
    Hi pmiguel
    I always find your post so helpful!!
    Indeed, I would like to ask just one more clarification about the second HMW peak "bubble product" appearing in my ChIP-seq libraries prep as well...
    You stressed more times that it shouldn´t be an issue for sequencing using Illumina platforms, as long as the quantification is performed by qPCR.
    I´ve submitted my ChIP-seq libraries but it didn´t work out so good (very low cluster density...). I´m afraid the problem might be the quantification step: I´ve quantified them by Qubit, because our facility requests this kind of quantification (our facility has never optimized the flow cell loading based on qPCR...).
    Could you give me some more hints about qPCR quantification vs Qubit!?
    I´m struggling since too long with this ChIP-seq...I need to make it work!!!
    Thank you!
    Emilia

    Leave a comment:


  • pmiguel
    replied
    Originally posted by NextGenSeq View Post
    It's a heteroduplex. Decades ago people used heteroduplex analysis for mutation screening.

    https://www.nationaldiagnostics.com/...uplex-analysis
    Uh, I think you are pushing the boundaries of the definition of "heteroduplex" here. But, same idea as far as migration goes. The large area of non-duplex double stranded DNA in the middle of the amplicon would be expected to retard migration though the matrix.

    Of course this is largely supposition. I haven't seen anyone actually test the "bubble product" hypothesis by digesting a double peak sample with something like S1 nuclease to show that the 2nd peak disappears and is replaced by a large amount of annealed adapter ends 60bp peak.

    Initially I had assumed that the retarded band was from "daisy chains" of products that were largely double stranded, but associated with each other by annealing at their adapters. That still seems like a possibility to me.

    --
    Phillip

    Leave a comment:


  • NextGenSeq
    replied
    It's a heteroduplex. Decades ago people used heteroduplex analysis for mutation screening.

    Double-stranded DNA is not a completely straight rigid rod. Sequence variations can cause bends in the double helix, or even alter the basic structure of the helix. A bend or kink in the DNA restricts its mobility through a sieving matrix, as the bent molecule presents a larger projected area to the gel pores. A…

    Leave a comment:


  • pmiguel
    replied
    Originally posted by AndyG View Post
    Method:

    Wang et al. 2011, A low-cost library construction protocol for Illumina-based strand-specific multiplex rna-seq. PLoS One 6(10) e26426. doi:10.1371/journal.pone.0026426

    Basics steps:

    Extract Total RNA
    Extract mRNA
    Fragment
    1st strand synthesis
    2nd strand synthesis
    End repair
    dA-Tail
    Ligate adaptors
    Size select
    Excise dUTP
    Amplify
    Bioanalyze with DNA HS Chip

    Problem:

    Bioanalysis with a DNA HS Chip, reveals a double hump in every library product.


    Notes:

    Libraries are individual i.e. not yet pooled.
    Yes Library 11 has a ~126bp adaptor dimer (already fixed).
    100ng mRNA input
    Qubit after cDNA synthesis (2nd strand) yields on average 8-10ng total
    Qubit after final library completion, anything from 8-30ng total from 14 cycles.
    Amplification step is definitely working (trace not shown).
    I made many more libraries with this method and the double humps just keep on coming.

    Questions:
    1. What is happening here, any theories?
    2. How do I fix this?


    EDIT - 26 Nov 13


    PCR artifacts are normally twice the expected library size as shown in the image above. Since my libraries are between 200-500bp which is exactly the expected size I don't believe my results are PCR artifact related, but I'm happy to be proven wrong. Notice in my samples the double humps are within the main library peak and not two separate peaks.

    [...]

    Things I have tried but made no difference:
    • Denaturing the libraries multiple different ways to prevent bird nesting or this so called “bubble effect” as suggested in other posts
    • I have tried re-amplifying my libraries for another 2 more cycles as suggest in other posts
    • Tried 12x, 13x, 14x, 15x, 16x, 17x cycles.
    I don't think there is much chance that "AndyG" is still monitoring this thread, but just in case anyone reading this now would be helped:

    Those double peaks are almost certainly a main peak and a "bubble product" peak. AndyG's protestations to the contrary suggest he doesn't get the concept.

    Bubble products are said to form when adapters from 2 product strands anneal to each other. Because a great number of different inserts will comprise a library, it is unlikely that any 2 product strands will be complementary in the middle. So you end up with the "bubble product", a molecule annealed and double stranded at either end but the non-complementary middle section remains as a double single-strand "bubble" domain.

    As you might imagine, this floppy thing migrates more slowly than its more compact fully double-stranded brethren. An Agilent chip will not correctly estimate its molecular weight by a variable amount. The fact that the two peaks overlap one another is not a sign that one is not a bubble peak.

    Normally bubble peaks cause no issues for sequencing as long as you use qPCR to estimate the concentration of your libraries.

    But, if you see bubble peaks, it is an indication that your PCR primer concentration has become limiting in the PCR reaction. At high primer concentrations, the primer annealing to a product strand will be kinetically favored over two product strands annealing.

    Strand melting your library and allowing the strands to find their correct complements is a waste of time. Don't do that.

    If you can't stand the idea of bubble products in you sample, you could probable get rid of most of them by adding your library to a fresh PCR reaction, with lots of primer and then doing a single cycle -- starting with a denaturation. This would allow the high amounts of primers to anneal and be extended into a double-stranded product.

    But this is also a waste of time. Again, the bubble products don't actually cause problems.

    They are an indication that you used more PCR cycles than were necessary. So you could cut back the number of cycles next time you made libraries.

    --
    Phillip

    Leave a comment:


  • pmiguel
    replied
    Originally posted by drops View Post
    Hi guys,
    how to quantify those "double peak" results in the bioanalyzer? Take both peaks together or just measure the first one?

    Is it possible to do a Kappa quantification? Should be not a problem, right? Qubit measurements I should not trust, I guess. Same as nanodrop.
    Any thoughts on that?

    thx
    D
    Yeah, if you are going to do qPCR, ignore the second peak. Use the small peak for the amplicon size. It works fine.

    But normally it is better to just cut back on your PCR cycles if you start seeing these.

    --
    Phillip

    Leave a comment:


  • drops
    replied
    double peaks

    Hi guys,
    how to quantify those "double peak" results in the bioanalyzer? Take both peaks together or just measure the first one?

    Is it possible to do a Kappa quantification? Should be not a problem, right? Qubit measurements I should not trust, I guess. Same as nanodrop.
    Any thoughts on that?

    thx
    D

    Leave a comment:


  • Kbb262
    replied
    AndyG, I know this post is a little bit late, but were you able to find out the problem? I've been getting these double peaks for my Illumina ChIP-seq preps and they are not artifacts or bubble products (they persist through denaturation and run similar on a RNA bioA chip). These fragments do not amplify during qPCR and also do not sequence, but yet are somehow amplified enough during library prep to appear as a significant peak. We are using a pippin prep to size select (which works extremely well) and these peaks appear outside our selected size range.

    Leave a comment:


  • chiaraf
    replied
    With truseqRNA I often see these libreries traces but I always sequence them with no problem.
    That's what Illumina suggests:

    How to fix bubble products
    To confirm this phenotype re-anneal the library slowly:
    1. Denature the library by heating to 95 degrees
    2. Slowly re-nature by cooling a degree a minute in a thermocycler by removing a heat block from an incubator and allowing it to cool to room temperature
    The bubble products will often resolve into normal double-stranded library
    In any case also without denaturation they are ok to be used and sequenced

    Leave a comment:

Latest Articles

Collapse

  • seqadmin
    Essential Discoveries and Tools in Epitranscriptomics
    by seqadmin


    The field of epigenetics has traditionally concentrated more on DNA and how changes like methylation and phosphorylation of histones impact gene expression and regulation. However, our increased understanding of RNA modifications and their importance in cellular processes has led to a rise in epitranscriptomics research. “Epitranscriptomics brings together the concepts of epigenetics and gene expression,” explained Adrien Leger, PhD, Principal Research Scientist...
    Yesterday, 07:01 AM
  • seqadmin
    Current Approaches to Protein Sequencing
    by seqadmin


    Proteins are often described as the workhorses of the cell, and identifying their sequences is key to understanding their role in biological processes and disease. Currently, the most common technique used to determine protein sequences is mass spectrometry. While still a valuable tool, mass spectrometry faces several limitations and requires a highly experienced scientist familiar with the equipment to operate it. Additionally, other proteomic methods, like affinity assays, are constrained...
    04-04-2024, 04:25 PM

ad_right_rmr

Collapse

News

Collapse

Topics Statistics Last Post
Started by seqadmin, 04-11-2024, 12:08 PM
0 responses
55 views
0 likes
Last Post seqadmin  
Started by seqadmin, 04-10-2024, 10:19 PM
0 responses
52 views
0 likes
Last Post seqadmin  
Started by seqadmin, 04-10-2024, 09:21 AM
0 responses
45 views
0 likes
Last Post seqadmin  
Started by seqadmin, 04-04-2024, 09:00 AM
0 responses
55 views
0 likes
Last Post seqadmin  
Working...
X