Seqanswers Leaderboard Ad

Collapse

Announcement

Collapse
No announcement yet.
X
 
  • Filter
  • Time
  • Show
Clear All
new posts

  • WJW-Davy
    replied
    Originally posted by cdf View Post
    Hi,
    I tried to use mapview with linux (using mono, of course) but I obtained this error:

    Code:
    Unhandled Exception: System.ComponentModel.Win32Exception: Access denied
      at System.Diagnostics.Process.set_PriorityClass (ProcessPriorityClass value) [0x00000] 
      at (wrapper remoting-invoke-with-check) System.Diagnostics.Process:set_PriorityClass (System.Diagnostics.ProcessPriorityClass)
      at 5k3wLwQTgnplU7ERSH.OBxZknnHvaWwL3tHML.395cY3App () [0x00000]
    If I try with root (using "sudo") the program works.

    The problem is that the program try to gain priority than the other process. On linux systems this is not possibile for normal users.

    I need to allow other users (that can not be administrators) to use the program under linux (we do not use windows). It is possibile to solve the problem (for example adding a command line parameter or checking the operating system)?

    Thank you very much
    Cristian
    Hi,Cristian

    Thank you for your message.

    I will add a command line parameter to change the process priority.

    WJW-Davy
    Leave a comment:


  • cdf
    replied
    Hi,
    I tried to use mapview with linux (using mono, of course) but I obtained this error:

    Code:
    Unhandled Exception: System.ComponentModel.Win32Exception: Access denied
      at System.Diagnostics.Process.set_PriorityClass (ProcessPriorityClass value) [0x00000] 
      at (wrapper remoting-invoke-with-check) System.Diagnostics.Process:set_PriorityClass (System.Diagnostics.ProcessPriorityClass)
      at 5k3wLwQTgnplU7ERSH.OBxZknnHvaWwL3tHML.395cY3App () [0x00000]
    If I try with root (using "sudo") the program works.

    The problem is that the program try to gain priority than the other process. On linux systems this is not possibile for normal users.

    I need to allow other users (that can not be administrators) to use the program under linux (we do not use windows). It is possibile to solve the problem (for example adding a command line parameter or checking the operating system)?

    Thank you very much
    Cristian

    Leave a comment:


  • iaaa99
    replied
    Thanks. I wonder if I can combine visualize 2 lanes in the same time. I have input and control and I do the splitter for each of the input and control. Can I visualize both of them in the same time

    Leave a comment:


  • baohua100
    replied
    You should specify the following items according to Bowtie output format:

    R: Read ID
    A: Read seq
    Q: Quality score(maybe x)
    C: Chromosome
    P: Mapping Position
    S: Strand(F/R or +/-)
    x: (neglected / pass over)


    For example:
    SOAP output:

    8:1:3:1697 GTCTAGATATCGCACAATCTTNAATCTTTAAAATG hhhhhhhhhhhhhhhhhhhhh;hhhhhhhhhhhhh 1 a 35 - chr1 1266 0


    So the corresponding format:

    R A Q x x x S C P <User-defiend> 1 0


    Sort 1 means the alignment position is not sorted. So MapView will sort.
    Reverse 1 means the read sequence (-) must be complementary reverse when display.

    Leave a comment:


  • iaaa99
    replied
    Can Mapview visualize Bowtie alignment? I tried using the user defined format it did not work

    Leave a comment:


  • Drake
    replied
    Thanks a lot! I really appreciate!

    Leave a comment:


  • baohua100
    replied
    X= The number of variant base with largest frequency
    Y= The number of the nucletide the same as reference base

    variant frequency= X/(X+Y)

    reference : T

    A: 30 T:60 G:10 C:5

    X= 30, Y=60 variant frequency=0.333


    reference: T

    A: 60 T:60 G:10 C:5

    X=60, Y=60 variant frequency=0.5


    Originally posted by Drake View Post
    Thanks a lot for your explanation! ... This is pretty much the same as MAQ does .. and I'm familiar with that.

    My question was rather how the 'variant frequency' is calculated?
    Referring to my attached picture:
    Row 370 does not have any variant base - so the percentage is zero.
    Row 369 has one variant base - so the percentage is 2 / 53 = 3.77%
    ...
    But how are 368 and 371 calculated?

    Thanks!

    Leave a comment:


  • Drake
    replied
    Originally posted by baohua100 View Post
    The SNP detection will look at each position in the contig to determine if there is a SNP at this position. In order to make a qualified and significant assessment, it needs three thresholds:

    (1). Minimum quality of central base. Bases with a quality score below this value are not considered in the SNP calculation at this position.

    (2). Minimum coverage. If SNPs were called in areas of low coverage, you would get a higher amount of false positives. Therefore you can set the minimum coverage for a SNP to be called. Note that the coverage is counted as the number of valid reads at the current position (i.e. the reads remaining when the quality assessment has filtered out the bad ones).

    (3). Minimum variant frequency. If only one read has a variant base, you probably do not want this to count as a SNP. This threshold is used to determine the minimum frequency for a variant to be called a SNP. Per default, the value is set to 0.4, which means that there should be a variant base in at least 40% of the bases in the valid reads before a SNP is called. Note that if you have two different variants with each having e.g. 20% frequency, it will not be counted as a SNP. If you sequence diploid genomes, you may have to lower this value to detect all SNPs.
    Thanks a lot for your explanation! ... This is pretty much the same as MAQ does .. and I'm familiar with that.

    My question was rather how the 'variant frequency' is calculated?
    Referring to my attached picture:
    Row 370 does not have any variant base - so the percentage is zero.
    Row 369 has one variant base - so the percentage is 2 / 53 = 3.77%
    ...
    But how are 368 and 371 calculated?

    Thanks!

    Leave a comment:


  • baohua100
    replied
    The SNP detection will look at each position in the contig to determine if there is a SNP at this position. In order to make a qualified and significant assessment, it needs three thresholds:

    (1). Minimum quality of central base. Bases with a quality score below this value are not considered in the SNP calculation at this position.

    (2). Minimum coverage. If SNPs were called in areas of low coverage, you would get a higher amount of false positives. Therefore you can set the minimum coverage for a SNP to be called. Note that the coverage is counted as the number of valid reads at the current position (i.e. the reads remaining when the quality assessment has filtered out the bad ones).

    (3). Minimum variant frequency. If only one read has a variant base, you probably do not want this to count as a SNP. This threshold is used to determine the minimum frequency for a variant to be called a SNP. Per default, the value is set to 0.4, which means that there should be a variant base in at least 40% of the bases in the valid reads before a SNP is called. Note that if you have two different variants with each having e.g. 20% frequency, it will not be counted as a SNP. If you sequence diploid genomes, you may have to lower this value to detect all SNPs.

    Leave a comment:


  • baohua100
    replied
    Besides for the base just the same as reference base. The variant is which has the largest frequency.

    Originally posted by Drake View Post
    Hello again,
    Can anyone explain me how the 'VariantFrequency' in the stat file is calculated?
    I mean, it's obvious how the frequency is calculated for one variant base. But how is it done for two or three variant bases?
    I also attached an excerpt from my stat file. Row 369 and 370 are clear to me, but would anyone be so kind to explain me the other two?

    Thanks in advance!

    Leave a comment:


  • Drake
    replied
    variant frequency

    Hello again,
    Can anyone explain me how the 'VariantFrequency' in the stat file is calculated?
    I mean, it's obvious how the frequency is calculated for one variant base. But how is it done for two or three variant bases?
    I also attached an excerpt from my stat file. Row 369 and 370 are clear to me, but would anyone be so kind to explain me the other two?

    Thanks in advance!
    Attached Files

    Leave a comment:


  • WJW-Davy
    replied
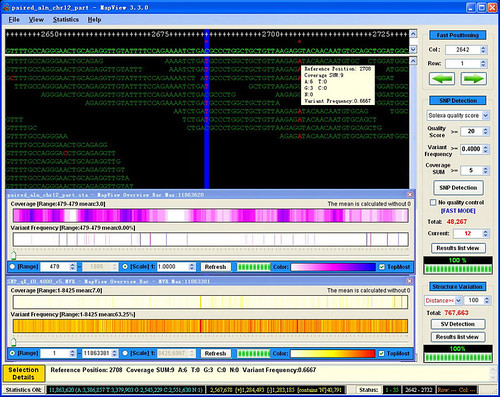
    3.3.0 [2009.5.10]
    The feature 'Overview Bar' map was added.
    Double-click one line of SNP list to jump to its position not its SNP No.

    Download Link 1: https://sites.google.com/site/wjwdav...attredirects=0

    Last edited by WJW-Davy; 05-10-2009, 03:46 AM.

    Leave a comment:


  • WJW-Davy
    replied
    download link:https://sites.google.com/site/wjwdav...attredirects=0

    3.2.0 [2009.5.7]
    The bug about dealing with ambiguous nucleotides was fixed. (Note: In order to deal with ambiguous nucleotides correctly, new MVF file should be made. )
    sta2txt feature was added.

    Leave a comment:


  • WJW-Davy
    replied
    Originally posted by Drake View Post
    Hi again,
    I became really interested in MapView; but unfortunately there are a few things making the output hard to trust.
    For example: I have a bad reference strain (bad means that there are ambiguous bases 'N' or 'S' in it). Then MapView produces an odd output for the reference. I have attached two cut screen shots. One is from MapView and one is from the NCBI viewer. Both have the same reference sequence.
    When you look at the MapView output, you see that on position 71275 and 71277 are ambiguous bases. Now look on the position after these two (71276, 71278 and 71279) .. you will see three 'T's and only one of the is true. You can easily compare it with the NCBI view. The marker is positioned on 71275. Position 71276 is a 'G', 71278 is a 'T' (this one is correct) and 71279 is a 'C'.

    Any suggestions why this happens?
    It is about dealing with ambiguous bases. I have found the bug and fixed it. Thank you.

    I will release the new version as soon as possible. And sta2txt feature will be added.

    Leave a comment:


  • baohua100
    replied
    Originally posted by Drake View Post
    Hi again,
    I became really interested in MapView; but unfortunately there are a few things making the output hard to trust.
    For example: I have a bad reference strain (bad means that there are ambiguous bases 'N' or 'S' in it). Then MapView produces an odd output for the reference. I have attached two cut screen shots. One is from MapView and one is from the NCBI viewer. Both have the same reference sequence.
    When you look at the MapView output, you see that on position 71275 and 71277 are ambiguous bases. Now look on the position after these two (71276, 71278 and 71279) .. you will see three 'T's and only one of the is true. You can easily compare it with the NCBI view. The marker is positioned on 71275. Position 71276 is a 'G', 71278 is a 'T' (this one is correct) and 71279 is a 'C'.

    Any suggestions why this happens?

    This a little bug about ambiguous base. We will fix it soon!

    Thank you for your message!

    Leave a comment:

Latest Articles

Collapse

  • seqadmin
    Essential Discoveries and Tools in Epitranscriptomics
    by seqadmin


    The field of epigenetics has traditionally concentrated more on DNA and how changes like methylation and phosphorylation of histones impact gene expression and regulation. However, our increased understanding of RNA modifications and their importance in cellular processes has led to a rise in epitranscriptomics research. “Epitranscriptomics brings together the concepts of epigenetics and gene expression,” explained Adrien Leger, PhD, Principal Research Scientist...
    04-22-2024, 07:01 AM
  • seqadmin
    Current Approaches to Protein Sequencing
    by seqadmin


    Proteins are often described as the workhorses of the cell, and identifying their sequences is key to understanding their role in biological processes and disease. Currently, the most common technique used to determine protein sequences is mass spectrometry. While still a valuable tool, mass spectrometry faces several limitations and requires a highly experienced scientist familiar with the equipment to operate it. Additionally, other proteomic methods, like affinity assays, are constrained...
    04-04-2024, 04:25 PM

ad_right_rmr

Collapse

News

Collapse

Topics Statistics Last Post
Started by seqadmin, 04-25-2024, 11:49 AM
0 responses
19 views
0 likes
Last Post seqadmin  
Started by seqadmin, 04-24-2024, 08:47 AM
0 responses
17 views
0 likes
Last Post seqadmin  
Started by seqadmin, 04-11-2024, 12:08 PM
0 responses
62 views
0 likes
Last Post seqadmin  
Started by seqadmin, 04-10-2024, 10:19 PM
0 responses
60 views
0 likes
Last Post seqadmin  
Working...
X