Unconfigured Ad

Collapse
X
 
  • Time
  • Show
Clear All
new posts
  • exo
    Member
    • Dec 2012
    • 26

    #1

    Visualizing SNPs throughout a circular genome

    Hi there,

    I recently sequenced 8 small viral genomes, and when compared to the only publicly available reference more than 250 SNPs were detected. For visualization, i thought it might be a good idea to make the genomes circular and then "plot" the SNPs around every circular genome. Do you know of any program that will be able to do that? I've only used CLC Genomics Workbench for my analysis up to now (sadly im still lacking the bioinformatic skills) and it doesnt support manipulating circular genomes.
    It would be nice to visualize if the SNPs actually form a "hot spot".

    Your input will be appreciated,
    Elias
  • Jetse
    Member
    • Nov 2012
    • 38

    #2
    Hi Elias,

    You can visualize your SNPs with IGV. CLC Genomics Workbench probably produced vcf files, which you can read into IGV . You have to index your vcf files first with igvtools or tabix.
    With IGV you can't make your genome circular, but you can show the SNPs of all samples at the same time to search for these hot spots.
    Last edited by Jetse; 09-06-2013, 12:51 AM.

    Comment

    • bishwo
      Junior Member
      • Jan 2012
      • 8

      #3
      Try Circos. http://www.biostars.org/p/66628/#66642

      Comment

      • LeightonP
        Member
        • Feb 2011
        • 29

        #4
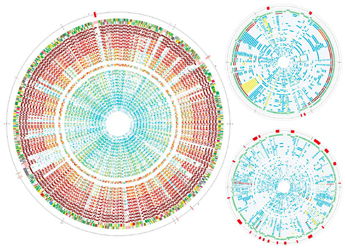
        Or Biopython's GenomeDiagram - you can get some quite complex images out of it:


        If anyone cares, the green assembly contig drawn as an inversion was a display bug, fixed https://t.co/BzqOjezsll
        Last edited by LeightonP; 09-07-2013, 08:34 AM.

        Comment

        • exo
          Member
          • Dec 2012
          • 26

          #5
          Perfect, thanks for the input!

          Comment

          Latest Articles

          Collapse

          • SEQadmin2
            Multiomic Liquid Biopsy: What DNA/RNA Panels Reveal That DNA Alone Can’t
            by SEQadmin2


            Tumors contain complex mixtures of cell populations that evolve in response to treatment and host-specific factors. Tissue biopsies provide only static snapshots of a tumor’s state. But what if we could follow that evolution over time using a minimally invasive technique?

            Liquid biopsies can detect tumor-derived material circulating in the bloodstream, providing a way to study treatment response, detect emerging resistance, and discover new biomarkers. Circulating
            ...
            10-14-2026, 09:55 AM
          • SEQadmin2
            New Genomics Technologies Take Aim at Long-Standing Limits
            by SEQadmin2


            Researchers using sequencing and genomics tools often have to make trade-offs. They can choose between speed or scale, short reads or long-range information, or targeted panels or a view of the whole transcriptome. New technologies that have been released this year are built to address those tough choices.

            We asked six companies the same four questions to learn about their latest products. The new technologies bring a lot to the table, including rethinking sequencing
            ...
            09-28-2026, 10:25 AM

          ad_right_rmr

          Collapse

          News

          Collapse

          Topics Statistics Last Post
          Started by SEQadmin2, 10-22-2026, 11:13 AM
          0 responses
          23 views
          0 reactions
          Last Post SEQadmin2  
          Started by SEQadmin2, 10-22-2026, 10:48 AM
          0 responses
          20 views
          0 reactions
          Last Post SEQadmin2  
          Started by SEQadmin2, 10-15-2026, 10:52 AM
          0 responses
          36 views
          0 reactions
          Last Post SEQadmin2  
          Started by SEQadmin2, 10-14-2026, 05:39 AM
          0 responses
          42 views
          0 reactions
          Last Post SEQadmin2  
          Working...