Unconfigured Ad

Collapse
X
 
  • Time
  • Show
Clear All
new posts
  • capricy
    Senior Member
    • Apr 2012
    • 125

    #1

    How to analyze these two figures

    The figures here showed the gene expression level (log scale) of two female individuals (top) and two male ones (bottom).

    Each spot represented a gene and each axis represented an individual.

    The figures suggested that, generally, genes with lower expression levels were more scattered.

    My question is:

    If the bottom figure (male expression profile) was considered to be the expected trend, how do I find the genes in the female (top figure ) that demonstrated more variable expression between two individuals?

    Thanks for any inputs!!
    Attached Files
  • TiborNagy
    Senior Member
    • Mar 2010
    • 329

    #2
    I think Wilcoxon test can be used in this case. You apply this test in every gene and check if there are significant differences between groups. Of course do not forget about multiple test correction.

    Comment

    • dpryan
      Devon Ryan
      • Jul 2011
      • 3478

      #3
      @TiborNagy: Testing for rank changes doesn't make sense if you're interested looking at changes in variability. Presumably Capricy is looking for genes with the same average expression between genders but increased variance in females or males.

      @Capricy: There are a number of methods out there for trying to measure changes in variability, but I don't think any of them will work well with N=2 per group.

      Comment

      • gringer
        David Eccles (gringer)
        • May 2011
        • 845

        #4
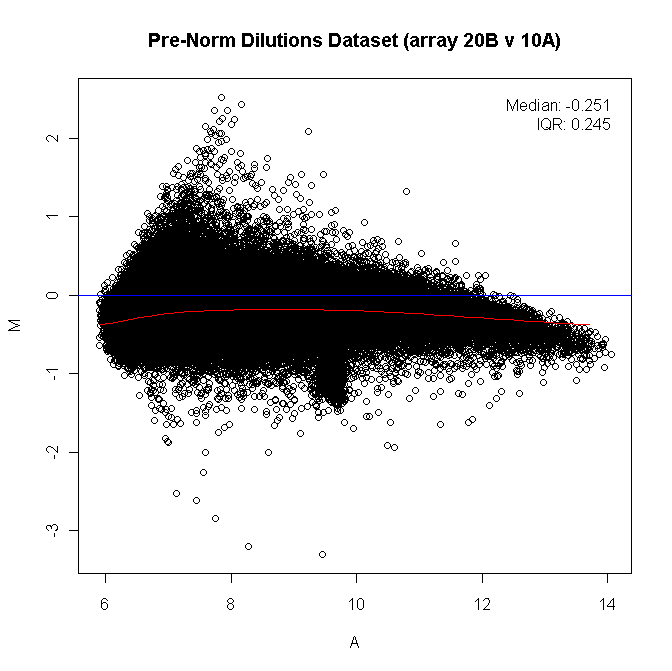
        I think it's more appropriate to demonstrate differences like this with a MA plot:


        In other words, plot mean expression on the X axis, and difference on the Y axis. It's generally the case that low expression values will have more variation. I prefer using smoothscatter for this because it makes density changes easier to see than a flat scatter plot:


        With respect to selection, you could use your male graph to generate a fitting curve for the female graph based on a running 95% percentile (or similar), and select the genes that reside outside the curve.

        Comment

        • capricy
          Senior Member
          • Apr 2012
          • 125

          #5
          @gringer: Could you explain more about how to generating the fitting curve for the graph? Or point me to any script/package I can use?

          Thanks

          And I re-graphed as you suggested: logFoldchange vs log(mean). The plot was attached here.

          The left one is the male and the right one is the female.
          Attached Files

          Comment

          Latest Articles

          Collapse

          • SEQadmin2
            16S/ITS Profiling vs. Shotgun Metagenomics: What Changes in Your Workflow?
            by SEQadmin2


            NGS has revolutionized clinical microbiology by offering new ways to identify and surveil pathogens without prior knowledge of the target. One popular approach is 16S rRNA and ITS amplicon sequencing, which targets specific microbial markers. But studies are increasingly incorporating shotgun metagenomics, a technique that sequences all DNA from a sample without targeting specific microbial markers. This approach allows more detailed taxonomic classification,...
            10-30-2026, 06:46 AM
          • SEQadmin2
            Multiomic Liquid Biopsy: What DNA/RNA Panels Reveal That DNA Alone Can’t
            by SEQadmin2


            Tumors contain complex mixtures of cell populations that evolve in response to treatment and host-specific factors. Tissue biopsies provide only static snapshots of a tumor’s state. But what if we could follow that evolution over time using a minimally invasive technique?

            Liquid biopsies can detect tumor-derived material circulating in the bloodstream, providing a way to study treatment response, detect emerging resistance, and discover new biomarkers. Circulating
            ...
            10-14-2026, 09:55 AM

          ad_right_rmr

          Collapse

          News

          Collapse

          Topics Statistics Last Post
          Started by SEQadmin2, Today, 07:59 AM
          0 responses
          13 views
          0 reactions
          Last Post SEQadmin2  
          Started by SEQadmin2, 11-05-2026, 09:25 AM
          0 responses
          32 views
          0 reactions
          Last Post SEQadmin2  
          Started by SEQadmin2, 11-03-2026, 11:54 AM
          0 responses
          45 views
          0 reactions
          Last Post SEQadmin2  
          Started by SEQadmin2, 10-28-2026, 09:57 AM
          0 responses
          170 views
          0 reactions
          Last Post SEQadmin2  
          Working...