 Tweet
Tweet
Hi,
I have list of sequences (17-35bases) with sequence read count in column 1.
I would like to see the end processing patterns of these sequences (to pile up similar ones and get the per-base coverage).
E.g. two sequences in my input file:
alignment of these sequences would look like that:
So the coverage of the first 3 nucleotides (TTG) is read count=4, for ATCCTTCGATGTCGGCTCTTCCT its 30+4=34 and for ATCAT it's 30
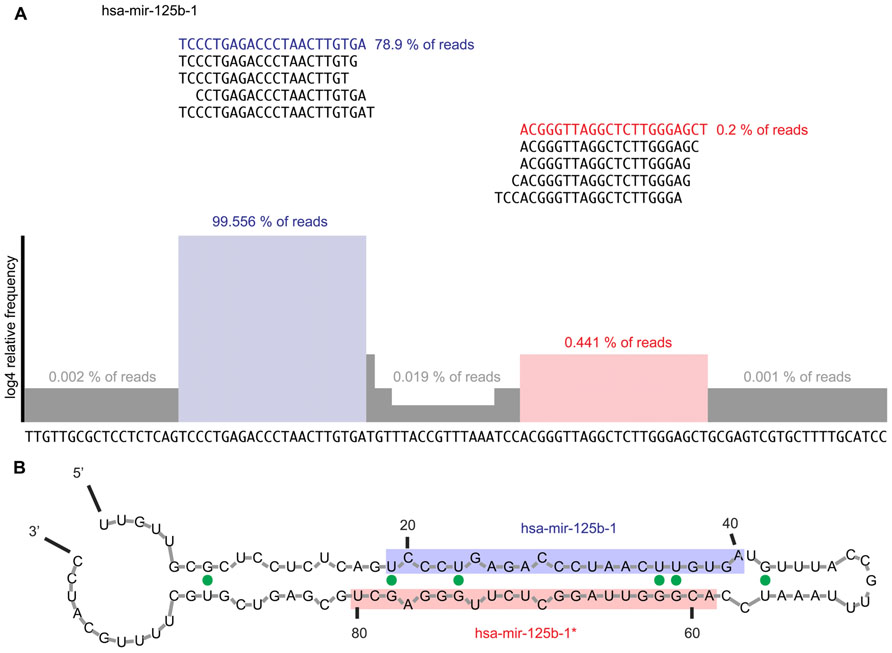
In principle, the end result/graph should look like this one here:
I know bedtools can output genomic coverage, but I'm afraid it won't be useful here...Does anybody have an idea how to solve this? I also have .sam files containing the same sequences, if that's of any help...
Thanks in advance
I have list of sequences (17-35bases) with sequence read count in column 1.
I would like to see the end processing patterns of these sequences (to pile up similar ones and get the per-base coverage).
E.g. two sequences in my input file:
Code:
      4 TTGATCCTTCGATGTCGGCTCTTCCT
    30 ATCCTTCGATGTCGGCTCTTCCTATCATT
Code:
 TTGATCCTTCGATGTCGGCTCTTCCT
    ATCCTTCGATGTCGGCTCTTCCTATCAT
In principle, the end result/graph should look like this one here:
I know bedtools can output genomic coverage, but I'm afraid it won't be useful here...Does anybody have an idea how to solve this? I also have .sam files containing the same sequences, if that's of any help...
Thanks in advance
Comment