Unconfigured Ad

Collapse
X
 
  • Time
  • Show
Clear All
new posts
  • vruotti
    Member
    • Feb 2008
    • 13

    #1

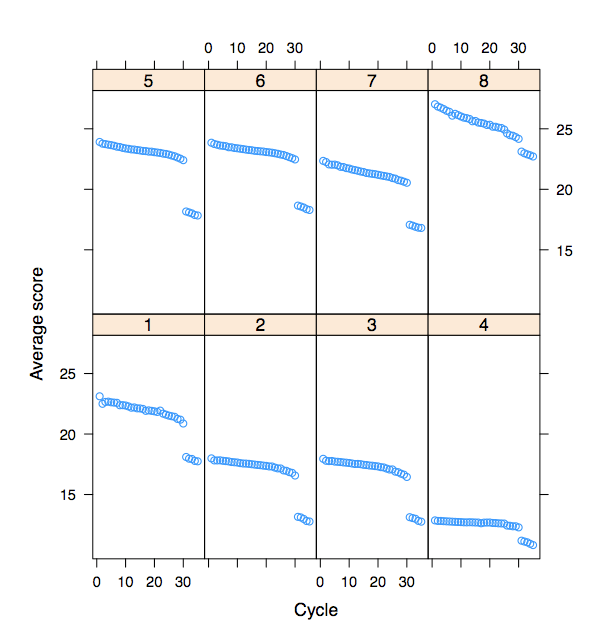
    Quality score graph

    Just wondering if anyone have seen the same problem with cycle 30.
    Thanks,
    Victor
  • new300
    Member
    • Mar 2008
    • 50

    #2
    it's not normal. This is for a single run? If you have the images look at the images, see if they get dimmer or something else strange happens at cycle 30. If you don't have the images then look at the intensity plots, do you have a significant drop in average intensity around cycle 30? What do the error rates for cycle 30+ look like on the control lane?

    Comment

    • glacerda
      Member
      • Aug 2008
      • 27

      #3
      This is Solexa, right?
      If it is, maybe you would like to look at that
      maybe you would like to look at that:

      Substantial biases in ultra-short read data sets from high-throughput DNA sequencing. 2008, July. Nucl. Acids Res.

      []s
      glacerda

      Comment

      • TylerBackman
        Member
        • Oct 2008
        • 13

        #4
        I already posted this answer in the other thread where you asked about this, but I thought I'd post it here as well. This is possibly an artifact of the Illumina pipeline quality score normalization rather than an actual sudden drop in quality.

        This is most likely because the qualities you are looking at are alignment normalized, and a large number of your sequences failed to align to the reference genome (due to a ligated adapter, etc.)

        Take a look at the un-normalized scores (s_<lane>_qraw.txt) instead, I think you'll find that the curve is more continuous between cycles.
        @1
        NNNNNNNNNNNNNNNNNNNNNNNNNNNNNNNNNNNN
        +
        """"""""""""""""""""""""""""""""""""

        Comment

        Latest Articles

        Collapse

        • SEQadmin2
          Multiomic Liquid Biopsy: What DNA/RNA Panels Reveal That DNA Alone Can’t
          by SEQadmin2


          Tumors contain complex mixtures of cell populations that evolve in response to treatment and host-specific factors. Tissue biopsies provide only static snapshots of a tumor’s state. But what if we could follow that evolution over time using a minimally invasive technique?

          Liquid biopsies can detect tumor-derived material circulating in the bloodstream, providing a way to study treatment response, detect emerging resistance, and discover new biomarkers. Circulating
          ...
          10-14-2026, 09:55 AM
        • SEQadmin2
          New Genomics Technologies Take Aim at Long-Standing Limits
          by SEQadmin2


          Researchers using sequencing and genomics tools often have to make trade-offs. They can choose between speed or scale, short reads or long-range information, or targeted panels or a view of the whole transcriptome. New technologies that have been released this year are built to address those tough choices.

          We asked six companies the same four questions to learn about their latest products. The new technologies bring a lot to the table, including rethinking sequencing
          ...
          09-28-2026, 10:25 AM

        ad_right_rmr

        Collapse

        News

        Collapse

        Topics Statistics Last Post
        Started by SEQadmin2, Yesterday, 11:13 AM
        0 responses
        16 views
        0 reactions
        Last Post SEQadmin2  
        Started by SEQadmin2, Yesterday, 10:48 AM
        0 responses
        15 views
        0 reactions
        Last Post SEQadmin2  
        Started by SEQadmin2, 10-15-2026, 10:52 AM
        0 responses
        35 views
        0 reactions
        Last Post SEQadmin2  
        Started by SEQadmin2, 10-14-2026, 05:39 AM
        0 responses
        42 views
        0 reactions
        Last Post SEQadmin2  
        Working...