Unconfigured Ad

Collapse
X
 
  • Filter
  • Time
  • Show
Clear All
new posts
  • flobpf
    Member
    • Apr 2010
    • 76

    High duplication levels in FASTQC

    Hi,

    I was using FASTQC to QC my directional mRNA-Seq data obtained from suspension culture cells. I have about 30 million reads.

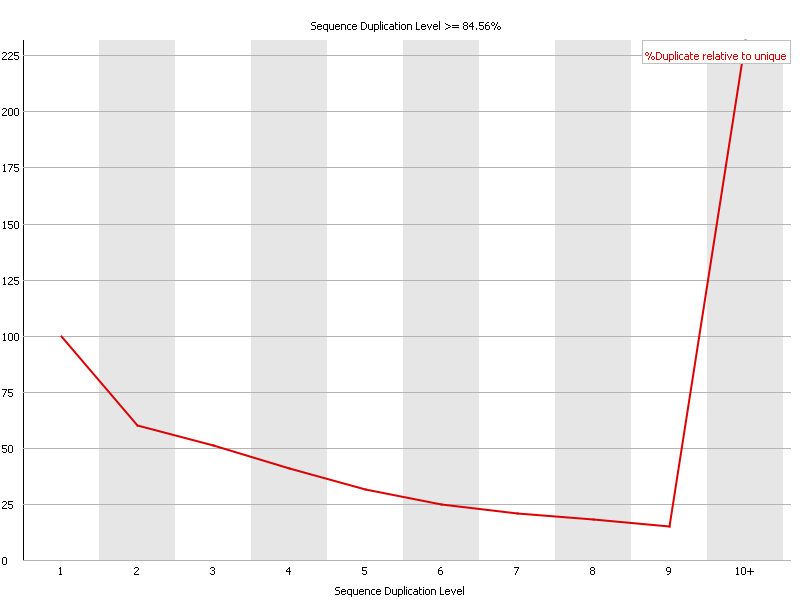
    Although most of my QC stats are fine, I see a big uptick in the "Duplicate sequences" section of sequences with duplication levels > 10 (see below). Sequence Duplication Level >84.56%.

    I was wondering what could be wrong. There were 2 possibilities I could think of:
    1) Some amplification bias in PCR and/or
    2) Since the RNA is not very diverse (its from suspension cells - same cell type) and sequenced to a high coverage, many sequences got sequenced multiple times.

    Wonder if the second reason makes sense? If it is true, by extension, it also means that we have successfully sequenced even the very low abundance transcripts. However, if it was PCR bias, that wouldnt be true. Wonder if there is a way to distinguish between these two possibilities?

    I'd appreciate any suggestions.

    Thanks
  • volks
    Member
    • Jun 2010
    • 80

    #2
    have a look at the alignments and you will know. generally i wouldnt trust fastqc duplication levels for mRNA seq too much ..

    Comment

    • simonandrews
      Simon Andrews
      • May 2009
      • 870

      #3
      The overall duplication level reported by FastQC needs to be taken in context with the shape of the profile you're seeing and also the results of the overrepresented sequence plot. There's a big difference between having a generally oversequenced sample (which often happens with RNA-Seq so you can see low expressed transcripts), and having a small number of sequences accounting for large chunks of your library.

      What FastQC can't do is to put the duplication in any kind of context. For libraries with expected uneven coverage (such as RNA-Seq) you'd need to look at the positions of the mapped data to see if you were getting even coverage over highly duplicated regions, which would suggest you simply have really high coverage, or duplicated patchy coverage which would indicate a techinical problem.

      If you haven't seen it already I wrote up a more detailed explanation of this on my blog since this is such a common thing to come up (the duplicate sequence plot is probably the least intuitive module to interpret in the FastQC output).

      Comment

      • arcolombo698
        Senior Member
        • Nov 2013
        • 142

        #4
        Fast QC Duplication

        Hello.

        I read your blog http://proteo.me.uk/2011/05/interpre...lot-in-fastqc/

        and find it helpful. I have the same problem.

        So at the end of the blog you mentioned to consider the per base quality plot to gain a realistic assessment of the duplication.

        In my case: My per base sequence quality is great. but I have the same image posted above, what does this imply?

        If my per base sequence quality passes, and I have a high sequence duplication levels, caused by the overrepresented sequence TrueSeq Adapter, can I then conclude that the quality is okay?

        Thank you

        Comment

        Latest Articles

        Collapse

        • SEQadmin2
          Advanced Sequencing Platforms Tackle Neuroscience’s Toughest Genomics Problems
          by SEQadmin2


          Genomics studies in neuroscience face a special challenge due to the brain’s complexity and scarcity of samples. Mapping changes in cell type and state using conventional next-generation sequencing methods remains challenging. Advances in technologies like single-cell sequencing, spatial transcriptomics, and long-read sequencing have opened the door to deeper studies of the brain and diseases like Alzheimer’s, amyotrophic lateral sclerosis (ALS), and schizophrenia.
          ...
          07-09-2026, 11:10 AM
        • SEQadmin2
          Cancer Drug Resistance: The Lingering Barrier to Rising Survival
          by SEQadmin2


          Cancer survival rates have significantly increased in the last few decades in the United States, reaching a combined 70% 5-year survival rate by 2021. Behind this number, there are years of research to find new therapies, drug targets, and early detection methods. But there is one core challenge that keeps slowing down these advances, and it’s about drug resistance.

          There is no single reason why many patients don’t respond to treatment as expected. Cancer is...
          07-08-2026, 05:17 AM
        • GATTACAT
          Reply to Nine Things a Sample Prep Scientist Thinks About Before Sequencing
          by GATTACAT
          Love this - good data definitely starts from good input, and poor input can only give relatively poor data. I particularly like the mention of Nanodrop/absorbance based methods for quantification. It's such a toss up if you'll get an accurate reading or what amounts to a randomly generated number, and a lot of library/sequencing related issues can be traced back to poor quant.
          07-01-2026, 11:43 AM

        ad_right_rmr

        Collapse

        News

        Collapse

        Topics Statistics Last Post
        Started by SEQadmin2, 07-13-2026, 10:26 AM
        0 responses
        20 views
        0 reactions
        Last Post SEQadmin2  
        Started by SEQadmin2, 07-09-2026, 10:04 AM
        0 responses
        32 views
        0 reactions
        Last Post SEQadmin2  
        Started by SEQadmin2, 07-08-2026, 10:08 AM
        0 responses
        20 views
        0 reactions
        Last Post SEQadmin2  
        Started by SEQadmin2, 07-07-2026, 11:05 AM
        0 responses
        34 views
        0 reactions
        Last Post SEQadmin2  
        Working...