Unconfigured Ad

Collapse
X
 
  • Time
  • Show
Clear All
new posts
  • bigmw
    Senior Member
    • Aug 2013
    • 124

    #1

    RNA-Seq Pathway and Gene-set Analysis Workflows in R/Bioconductor with GAGE/Pathview

    The gage package (2.12.0) now includes a new tutorial, "RNA-Seq Data Pathway and Gene-set Analysis Workflows". Note you need to update to current release versions of R(3.0.2)/ Bioconductor(2.13) to use all the features. Please check it out:
    Generally Applicable Gene-set Enrichment for Pathway Analysis


    We first cover a full workflow from preparation, reads counting, data preprocessing, gene set test, to pathway visualization in about 40 lines of codes. The same workflow can be used for GO analysis or other types of gene set analysis too. We also describe joint workflows, i.e. to do gene-level analysis using one of the major RNA-Seq analysis tools, DEseq/DEseq2, edgeR, limma and Cufflinks, and feed the results into GAGE/Pahview for pathway analysis or visualization. All these workflows are implemented in R/Bioconductor.
    Comments and questions are welcome. Thanks!

    Last edited by bigmw; 10-21-2013, 03:52 PM.
  • bigmw
    Senior Member
    • Aug 2013
    • 124

    #2
    GAGE and Pathview can be used independent of each other. GAGE does pathway and Gene-set Analysis, and works on other tyeps of gene sets than pathways, like GO, coexpressed/coregulated gene sets, TF or miRNA target lists etc. Pathview may integrate and visualizeuser data onto pathway graphs independent of pathway analysis procedure.

    Pathview package available at:
    a tool set for pathway based data integration and visualization

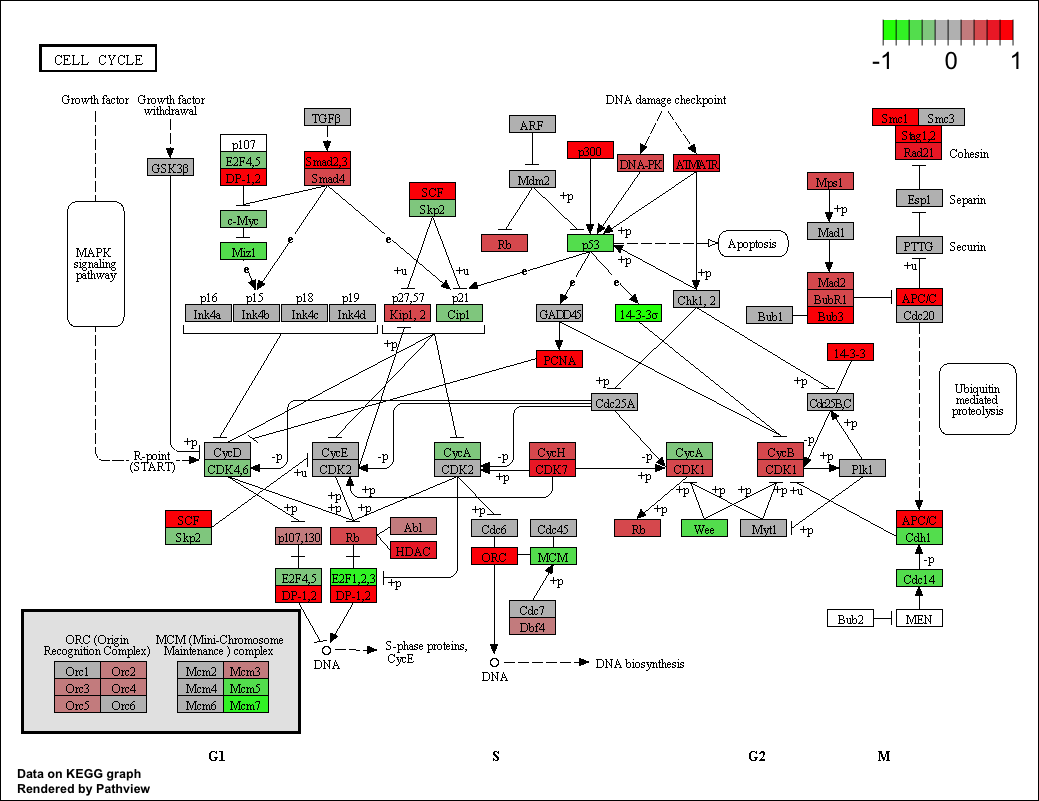
    Here is the info page with example output:

    Comment

    • entrez
      Junior Member
      • Nov 2010
      • 7

      #3
      I’ve both gage and pathview installed on my computer. I tried to follow the example in the native workflow. Things work well, except I didn’t get 4 samples show up in the same graph (or nodes with 4 slices) as in Figure 2 of the workflow document, instead I got 4 separate graphs. What I might have done wrong?

      Comment

      • bigmw
        Senior Member
        • Aug 2013
        • 124

        #4
        What versions of gage, pathview and Bioconductor you have?

        Comment

        • entrez
          Junior Member
          • Nov 2010
          • 7

          #5
          gage 2.10.0, pathview 1.1.4 and Bioconductor 2.12

          Comment

          • bigmw
            Senior Member
            • Aug 2013
            • 124

            #6
            pathview 1.1.4 does not show multiple samples/states in the same graph, you need to upgrade to the current release, which is 1.2.0: http://bioconductor.org/packages/rel.../pathview.html.
            I would recommend to do an overall upgrade to R 3.0.2/Bioconductor 2.13, which will update your pathview and gage to the latest version too.

            Comment

            • bigmw
              Senior Member
              • Aug 2013
              • 124

              #7
              If you don’t know how to upgrade Bioc, please check:
              The Bioconductor project aims to develop and share open source software for precise and repeatable analysis of biological data. We foster an inclusive and collaborative community of developers and data scientists.

              Here is some work around if you get problems:

              Comment

              • entrez
                Junior Member
                • Nov 2010
                • 7

                #8
                Can I use the workflow (with necessary changes) for microarray data analysis? If so, how?

                Comment

                • bigmw
                  Senior Member
                  • Aug 2013
                  • 124

                  #9
                  GAGE/Pathview workflow can be applied for microarray data analysis. Please check the main tutorials of gage and pathview for details:

                  Comment

                  • bigmw
                    Senior Member
                    • Aug 2013
                    • 124

                    #10
                    Pathview is actually applicable to any data mappable to pathways, including gene, protein, metabolite, genetics, literature, and others. The tutorial describes examples on metabolite/compound data too.

                    Comment

                    • crazyhottommy
                      Senior Member
                      • Apr 2012
                      • 187

                      #11
                      Hi I was playing around with GAGE, one question is that I got the count table by HTSeq, and the ids are gene names for each row, how can I change the gene names to GO term ids?

                      Thanks

                      Comment

                      • bigmw
                        Senior Member
                        • Aug 2013
                        • 124

                        #12
                        You don’t have to change gene names/IDs to GO term IDs. GAGE (or other gene set analysis tools) requires two major input data objects: your expression data (vector or matrix-like) and gene set list (list of gene ID vectors). Make sure your gene IDs in expression data and gene set list are the same type, i.e. both are Entrez Gene IDs, or both gene symbols, etc.
                        You may want to go through the basics and common use of gage described in the main gage vignette:

                        if you want a quick start, section 1, 6 and 7 (page 1, 4-8) would be enough. You will see examples for both KEGG and GO analysis.

                        Comment

                        • bigmw
                          Senior Member
                          • Aug 2013
                          • 124

                          #13
                          If you follow the RNA-seq workflows (links in the first post above), we can actually work on the demo examples from Step 2. In other words, we can start with the pre-mapped raw read counts data (from previous steps), i.e. hnrnp.cnts stored in gageData. I would suggest you to run the demo example and explore gage/pathview functions and input/output data by yourself.

                          Comment

                          • crazyhottommy
                            Senior Member
                            • Apr 2012
                            • 187

                            #14
                            Thank you!

                            Comment

                            • wilson90
                              Member
                              • May 2012
                              • 48

                              #15
                              In your vignette, we are suppose to provide our annotation file.
                              I wonder where have you obtained "kegg.gs"?
                              and I want to use GO annotation. So where can I obtain "GO.gs" in R?
                              Thank you.

                              Frustrated user

                              Comment

                              Latest Articles

                              Collapse

                              • SEQadmin2
                                New Genomics Technologies Take Aim at Long-Standing Limits
                                by SEQadmin2


                                Researchers using sequencing and genomics tools often have to make trade-offs. They can choose between speed or scale, short reads or long-range information, or targeted panels or a view of the whole transcriptome. New technologies that have been released this year are built to address those tough choices.

                                We asked six companies the same four questions to learn about their latest products. The new technologies bring a lot to the table, including rethinking sequencing
                                ...
                                Yesterday, 10:25 AM
                              • SEQadmin2
                                How Immunogenomics Decodes Immunity’s Genetic Blueprint
                                by SEQadmin2


                                The immune system’s power comes from its genetic diversity, allowing myriad threats to be neutralized through first recognizing foreign antigens. That diversity is also what makes the immune system so difficult to study. Recent advances in sequencing technology and computational biology, however, are giving researchers new tools to understand immune responses and immune-related diseases in greater detail.

                                This convergence of genetics, immunology, and computation...
                                09-01-2026, 05:41 AM

                              ad_right_rmr

                              Collapse

                              News

                              Collapse

                              Topics Statistics Last Post
                              Started by SEQadmin2, Today, 09:51 AM
                              0 responses
                              7 views
                              0 reactions
                              Last Post SEQadmin2  
                              Started by SEQadmin2, 09-25-2026, 09:06 AM
                              0 responses
                              31 views
                              0 reactions
                              Last Post SEQadmin2  
                              Started by SEQadmin2, 09-23-2026, 11:05 AM
                              0 responses
                              27 views
                              0 reactions
                              Last Post SEQadmin2  
                              Started by SEQadmin2, 09-18-2026, 11:37 AM
                              1 response
                              47 views
                              0 reactions
                              Last Post pekgio
                              by pekgio
                               
                              Working...